

Before01
Company overview
- HVAC drives energy use
- Carbon data demanded
- Uneven manual control
AX Solution
Energy-cost optimization realized through data-driven intelligent control
OVERVIEW
Beyond watching consumption: the operating conditions of the equipment itself come into the AI’s control range.
KEY FEATURES
From real-time monitoring through equipment efficiency and demand forecasting to carbon management.
Energy Capability
01 / 04
01
It collects and visualizes the power consumption of key equipment and lines across the plant in real time. Energy consumption is grasped at a glance so waste is caught immediately, and peak-demand periods are managed to realize cost savings.
Management Scope
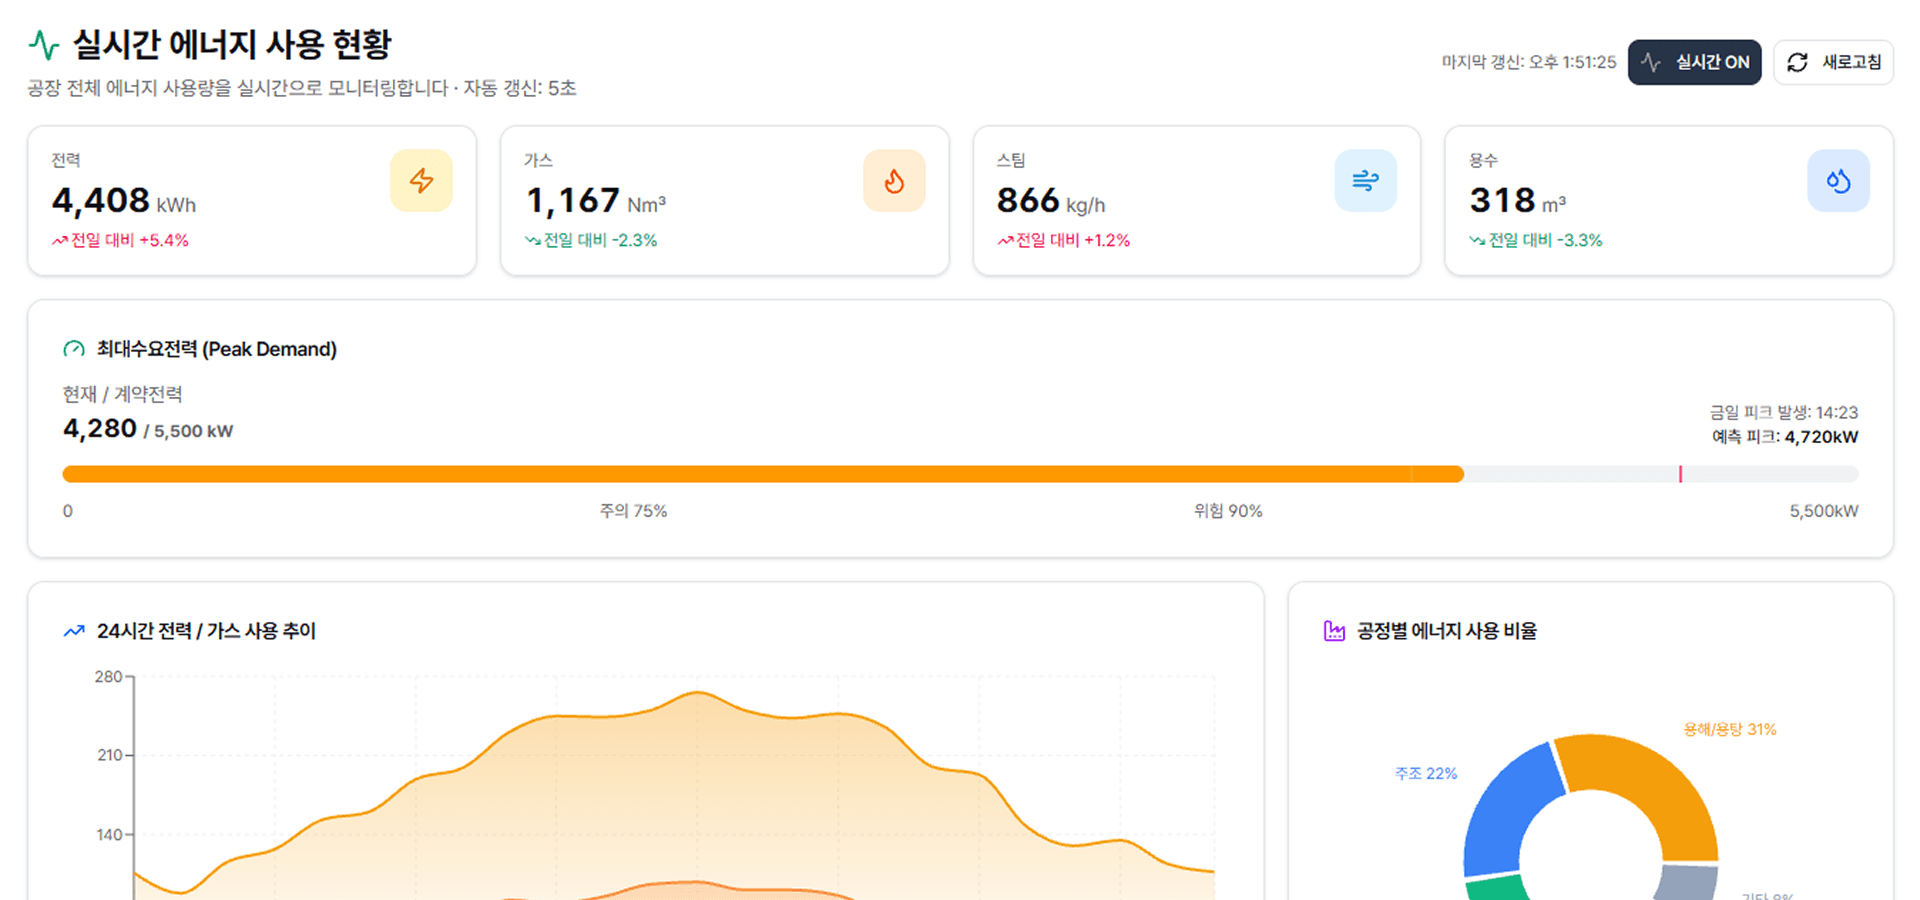
Real-time energy monitoring
Tracks electricity, gas, steam and other energy use across the whole plant and its main equipment in real time
SYSTEM ARCHITECTURE
Floor energy data collected and analysed, then returned to how the equipment runs.
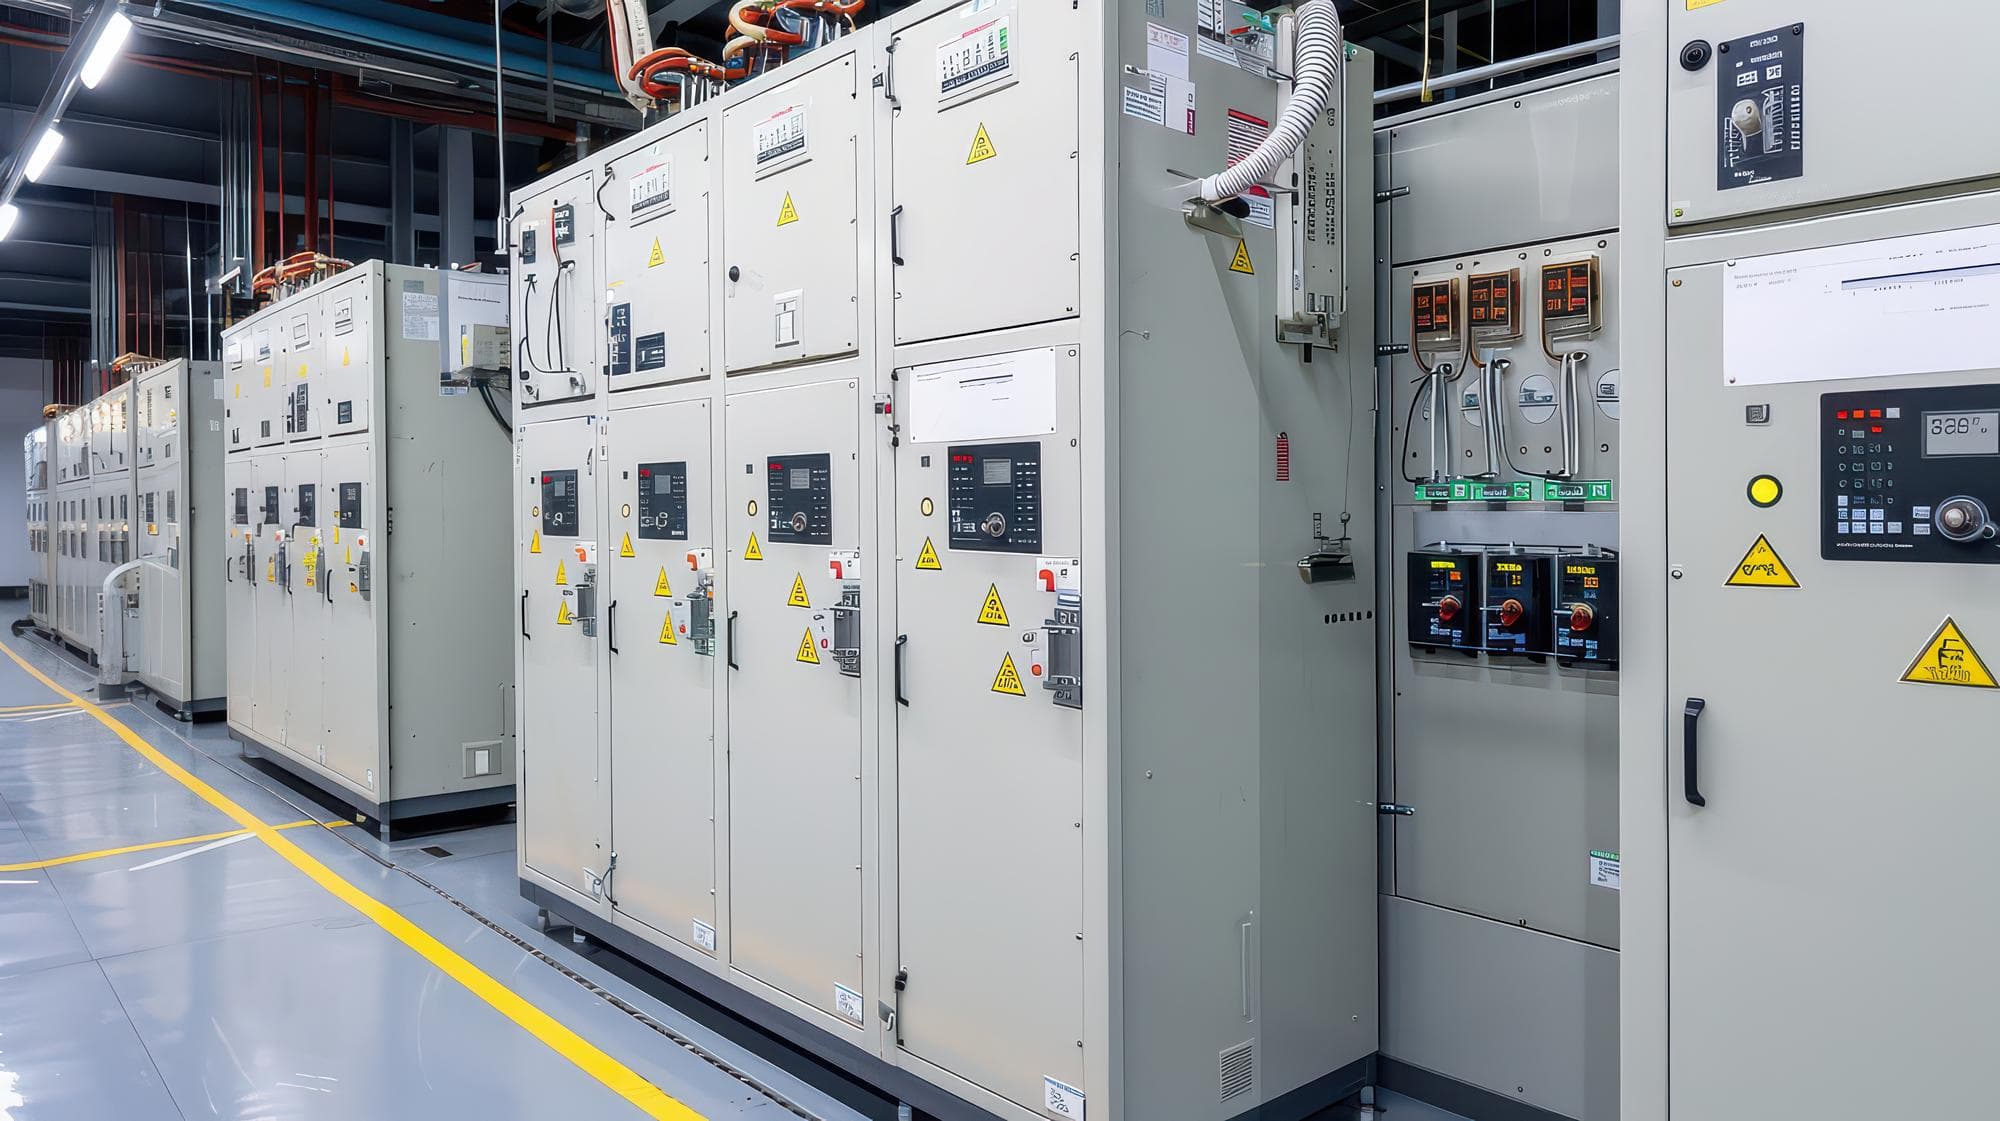
Power management
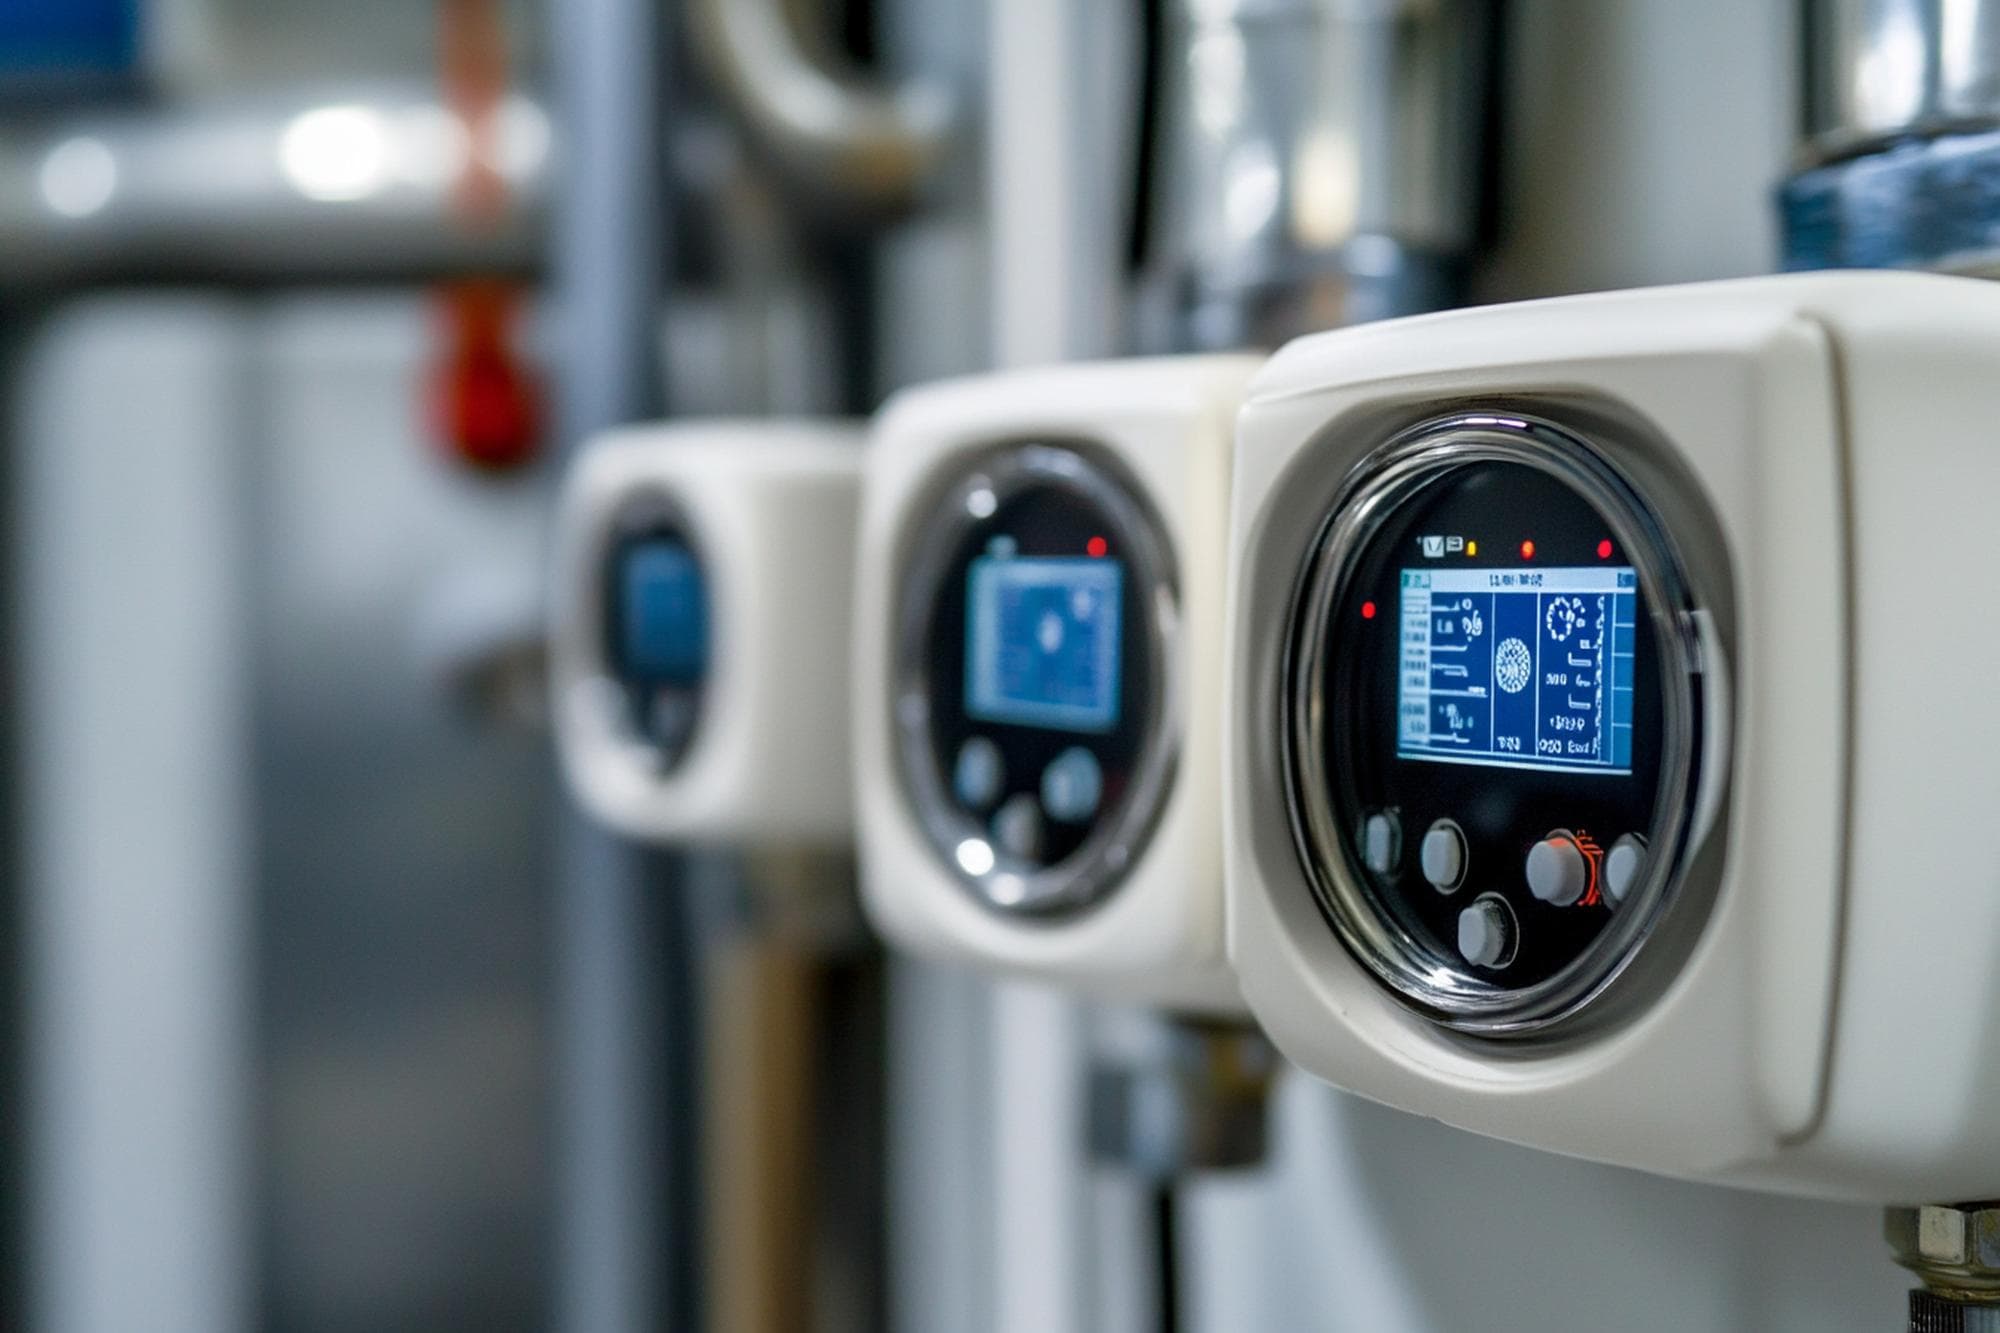
HVAC systems

Smart buildings
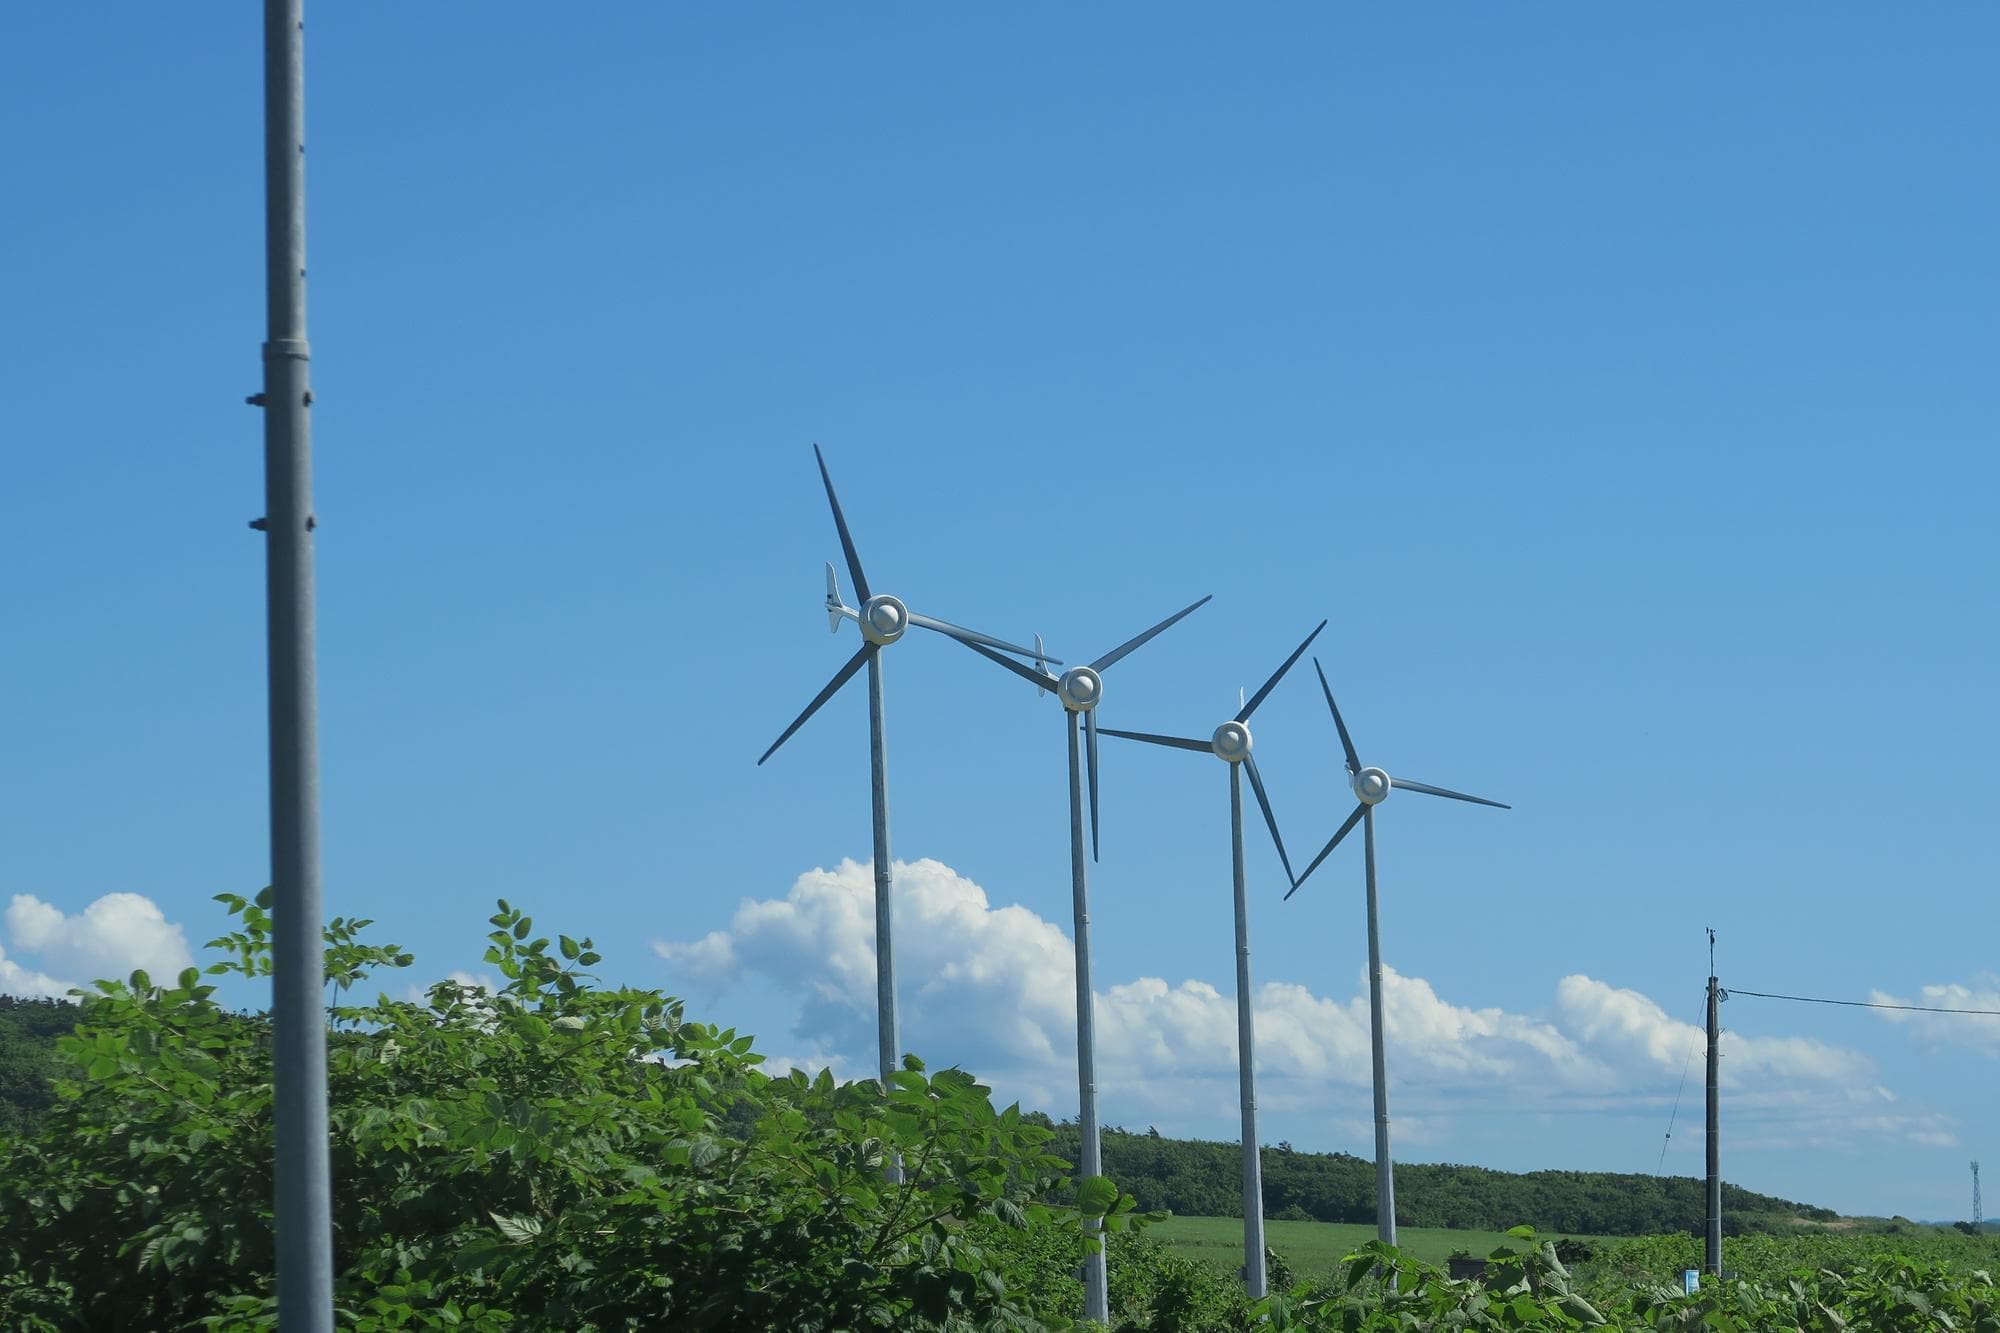
Renewable energy

Data centers

Lighting and utilities
Power management
HVAC systems
Smart buildings
Renewable energy
Data centers
Lighting and utilities
Energy is not used sparingly. It is used when it should be.
EFFECT
What it leaves behind — in energy intensity, demand peaks, energy cost and renewable share.
BUSINESS OUTCOME
Lower energy intensity
Energy per unit produced is broken down by process to find the waste, and optimal set-points per machine cut standby loss.
Intensity · standby loss · set-points
Lower demand peaks
Overlapping loads are predicted and spread across the schedule, so the contracted demand limit is not crossed.
Peak demand · load spreading · contract limit
Lower energy cost
Peak charges and standby loss come down together, and tariff and run plan are matched so the same output costs less to power.
Electricity · gas · run plan
Higher renewable share
Generation forecast and load plan are matched so self-generated power is used first, and the renewable share is tracked with the certificates that prove it.
Renewable share · self-consumption · certificates
CASE STUDY
Model predictive control cut HVAC energy by 15-30% while carbon data was managed alongside it.
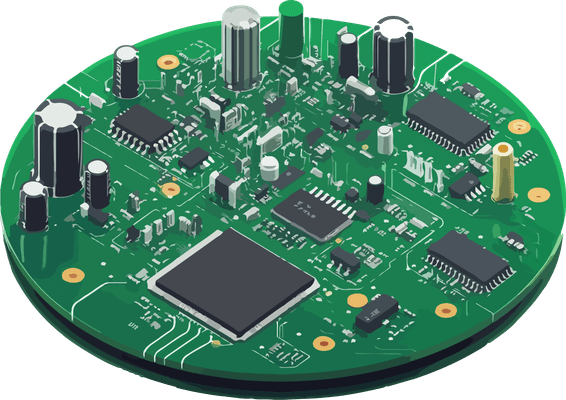
Customer industry
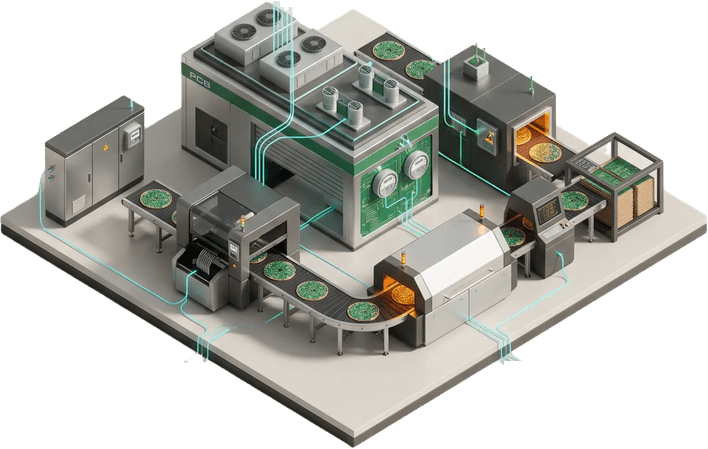
High-layer-count PCB (MLB) manufacturing
Before01
After02
Business impact
Energy optimisation where AI runs the HVAC on its own
Energy is not about using less. It is about choosing when.
From a per-asset usage read to a control plan matched to your tariff — the saving in numbers first.
Talk to us