


Before01
Company profile
- 40% of sales in Europe
- No in-plant measuring
- Scope 3 unprovable
GX Solution
Circular Operations for Resource Assessment
A data optimization platform for trustworthy data
OVERVIEW
It starts by setting out what is emitted, where and how much, in a form that can be measured.
KEY CAPABILITIES
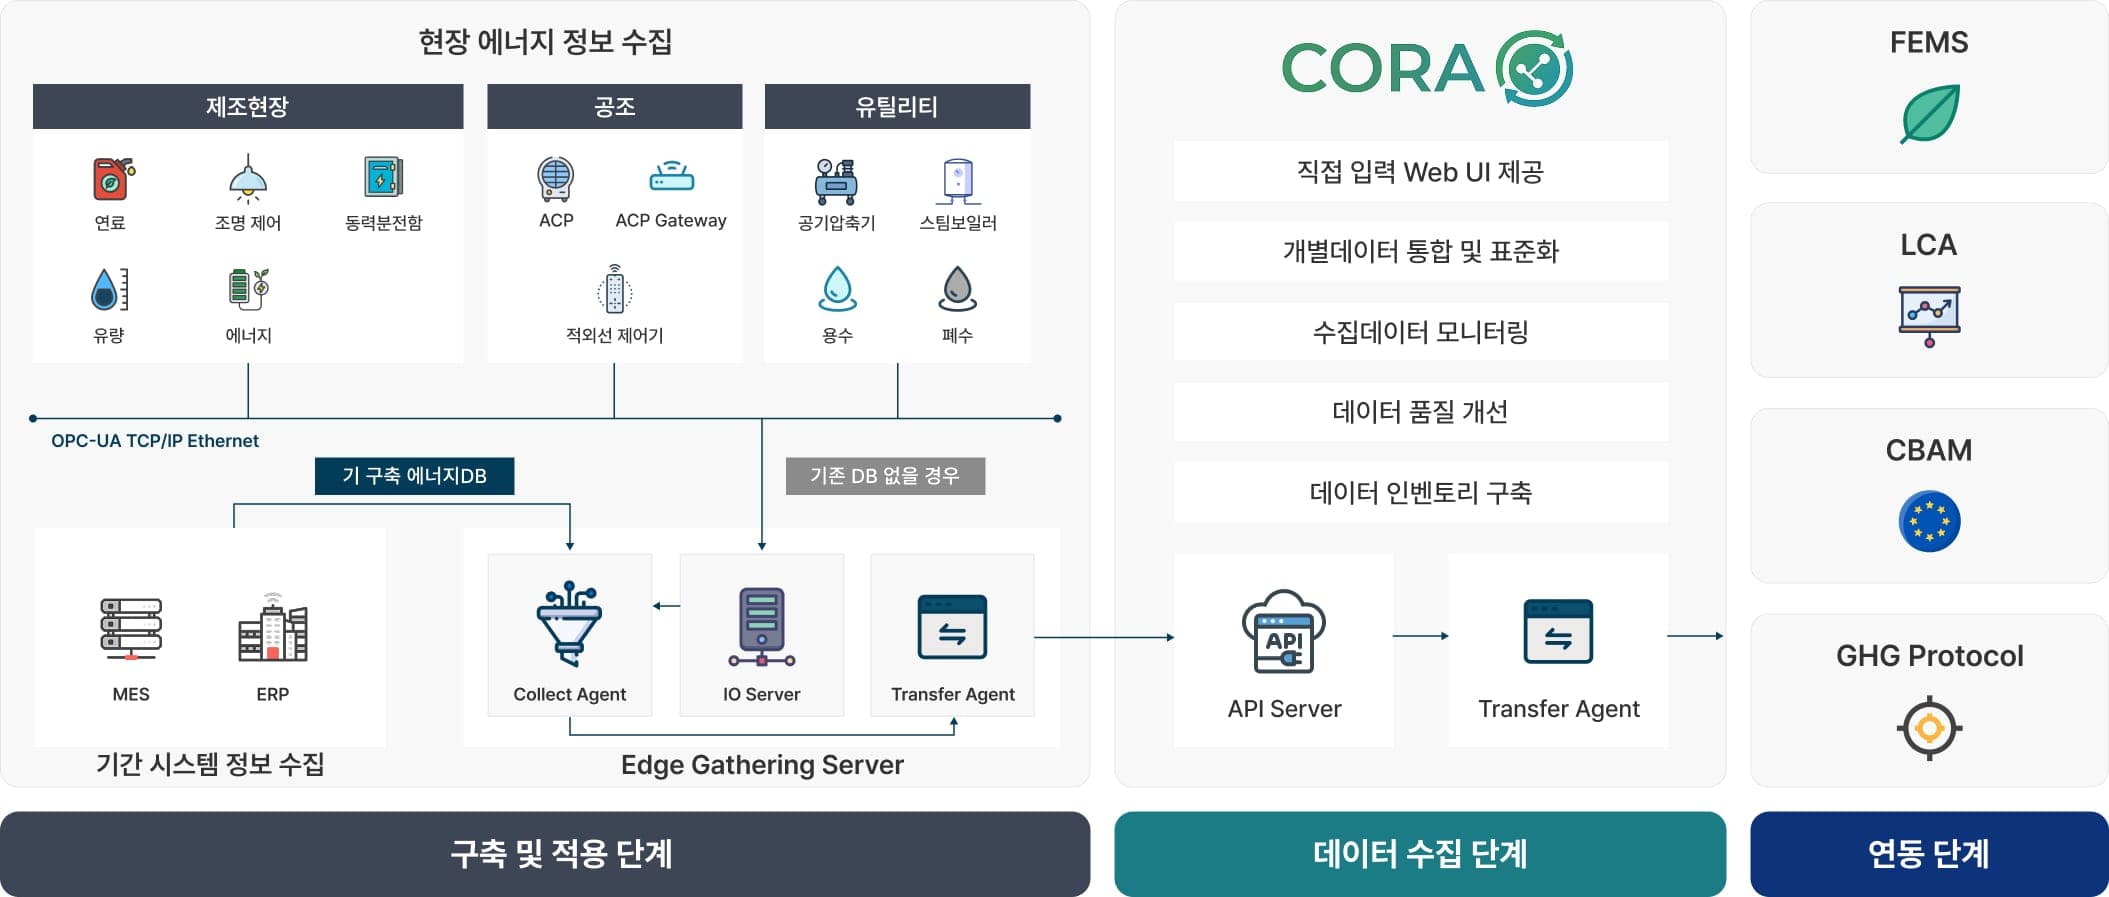
From the data inventory through infrastructure and integrated collection to AAS-based interoperability.
Carbon Data Capability
01 / 04
01
We systematically identify and catalog the location, form and character of the company's internal data assets. Beyond simply gathering data, we clearly define what data exists where, and how it should be used, for carbon emission accounting and production efficiency optimization.
Management Scope
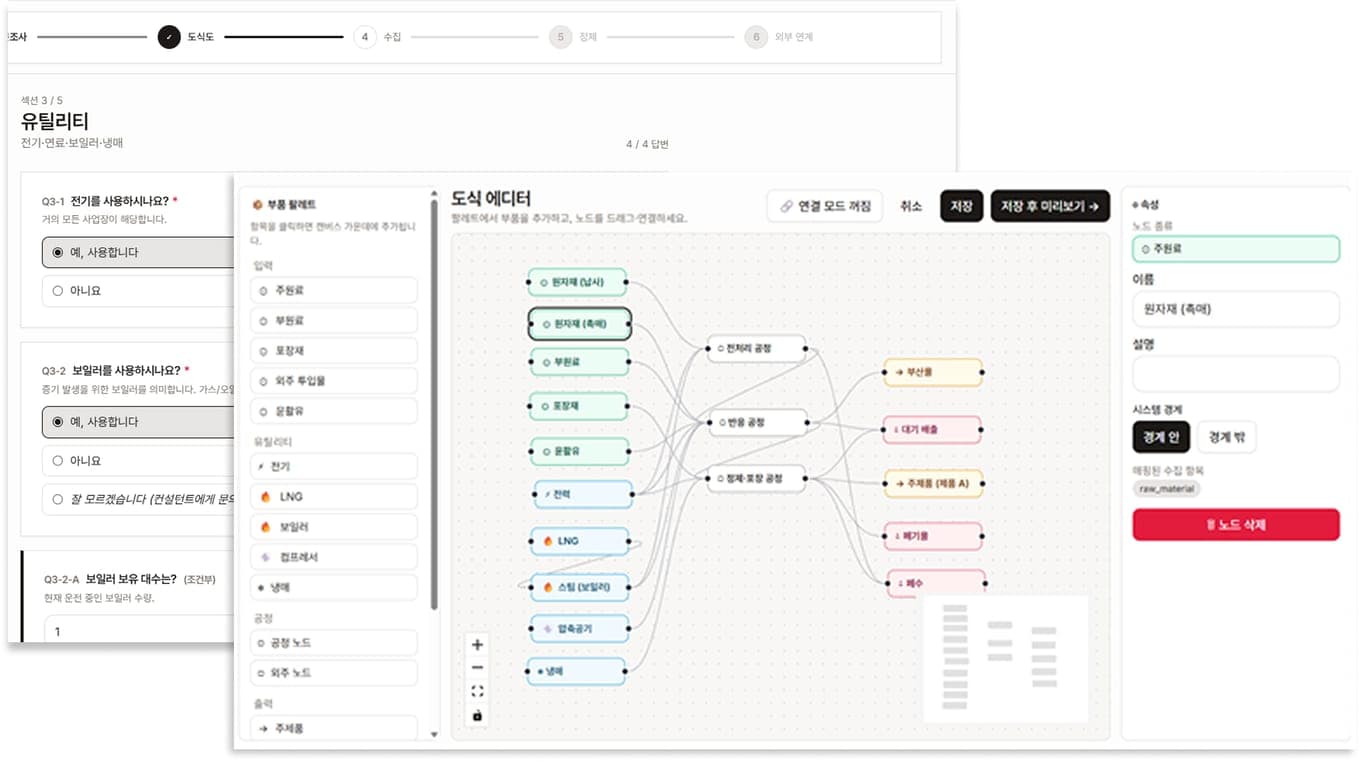
Data inventory
Every data asset in the organisation is located, listed and its state recorded.
Steel and metal manufacturing
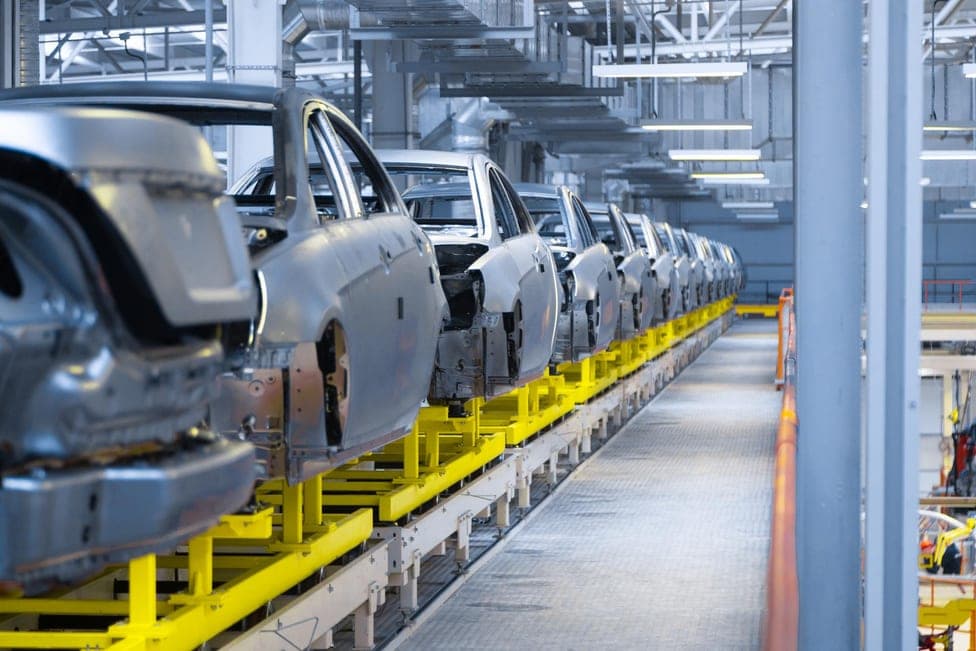
Automotive and batteries

Advanced industries

Defense and aerospace

Chemical industry
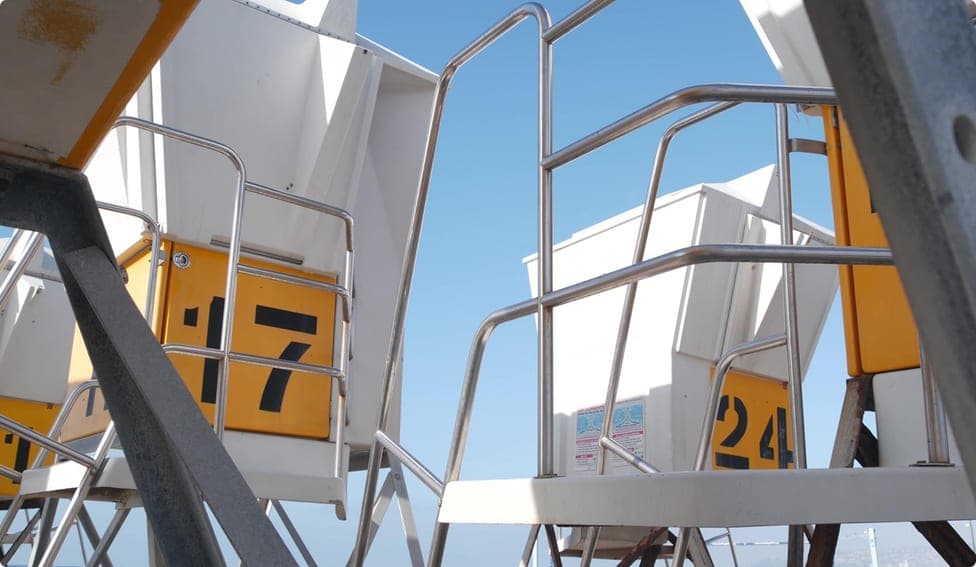
Construction industry
Steel and metal manufacturing
Automotive and batteries
Advanced industries
Defense and aerospace
Chemical industry
Construction industry
FUNCTION MAP
How carbon data runs from collection through calculation to reporting.
REFERENCE DATACORACarbon Inventory
Select a module around the hub to read its detail.
Its input, the CORA processing and the output flow appear in this area.
ARCHITECTURE PROCESS
From preparation to data exchange, and what each stage leaves behind.


EFFECT
What it leaves behind — in cost, reporting time, regulatory readiness and staffing effort.
BUSINESS OUTCOME
Cost savings
System boundary, infrastructure and the AAS conversion engine are put in place in one go, brought in-house as a lasting capability, and a new regulation is met by extending what exists rather than reinvesting.
Scope of build · in-house capability · reinvestment
Less time spent aggregating data and writing reports
Integrated infrastructure shortens data collection, regulatory reports are issued faster, and the hours spent on manual, repetitive administration fall away.
Collection time · issuing speed · manual work
Regulatory response capability
Heavy carbon tax penalties are avoided, revenue lost by being dropped from a supply chain is prevented, and damages from customs and delivery delays are headed off.
Penalties · lost revenue · delay damages
In-house specialist workload
The pressure to hire environmental specialists eases, rework spent correcting data errors shrinks, and resources for smart-factory upgrades are freed.
Hiring pressure · rework · upgrade resources
CASE STUDY
Product-level carbon evidence automated into the AAS standard, keeping the European supply chain intact.
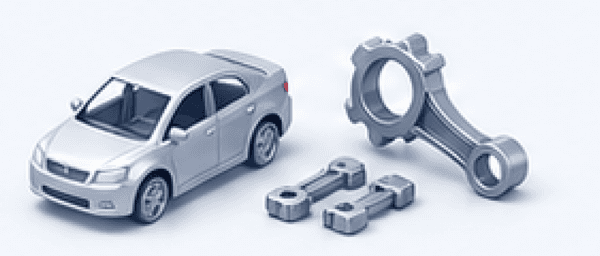
Customer industry
Automotive powertrain parts manufacturing
Before01
After02
Results
Build CORA and export carbon data on an international standard
Collecting carbon data is easy. Making it defensible is not.
We review your emission sources and calculation basis, and design data that survives verification.
Talk to us