

Before01
Company profile
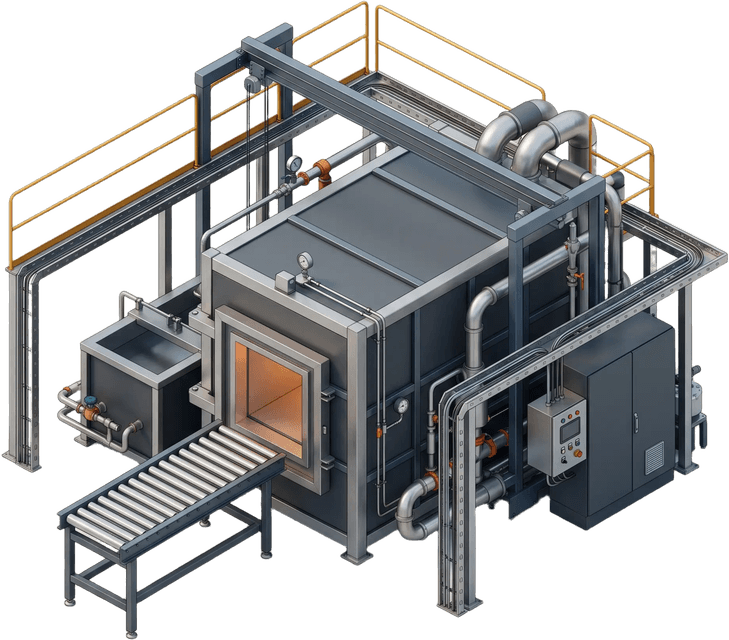
- Uneven furnace heat
- Operator-led variance
- Late cause tracing
AX Solution
Quality innovation through the intelligence of process data
OVERVIEW
Quality management moves from after-the-fact inspection to prediction while the process runs.
Quality is judged at final inspection, so a defect shows up in parts that are already made — long after the process condition that caused it has passed.
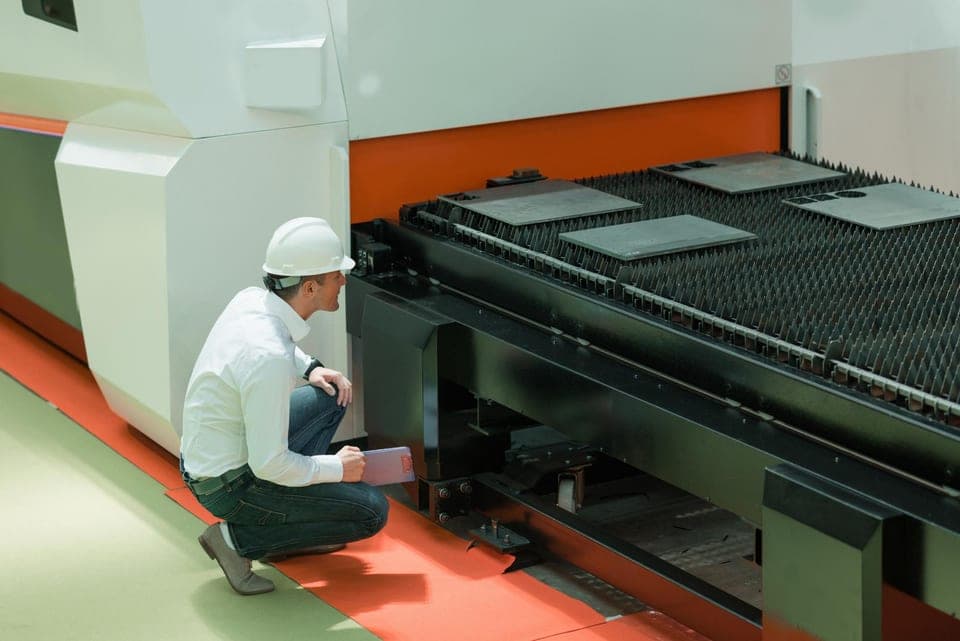
When a problem occurs, the root cause is hard to identify, and quality management keeps relying solely on the personal experience of highly skilled operators.

Quality issues increase work-in-process and rework volume, so production time grows longer and manufacturing costs rise
KEY FEATURES
From real-time detection through factor analysis and defect prediction to process optimisation.
Quality Capability
01 / 04
01
Data from the various sensors and equipment installed across the process is collected in real time and visualized on a dashboard. The state of the production floor can be grasped at a glance, providing the visibility to respond immediately to unexpected stoppages or errors.
Management Scope
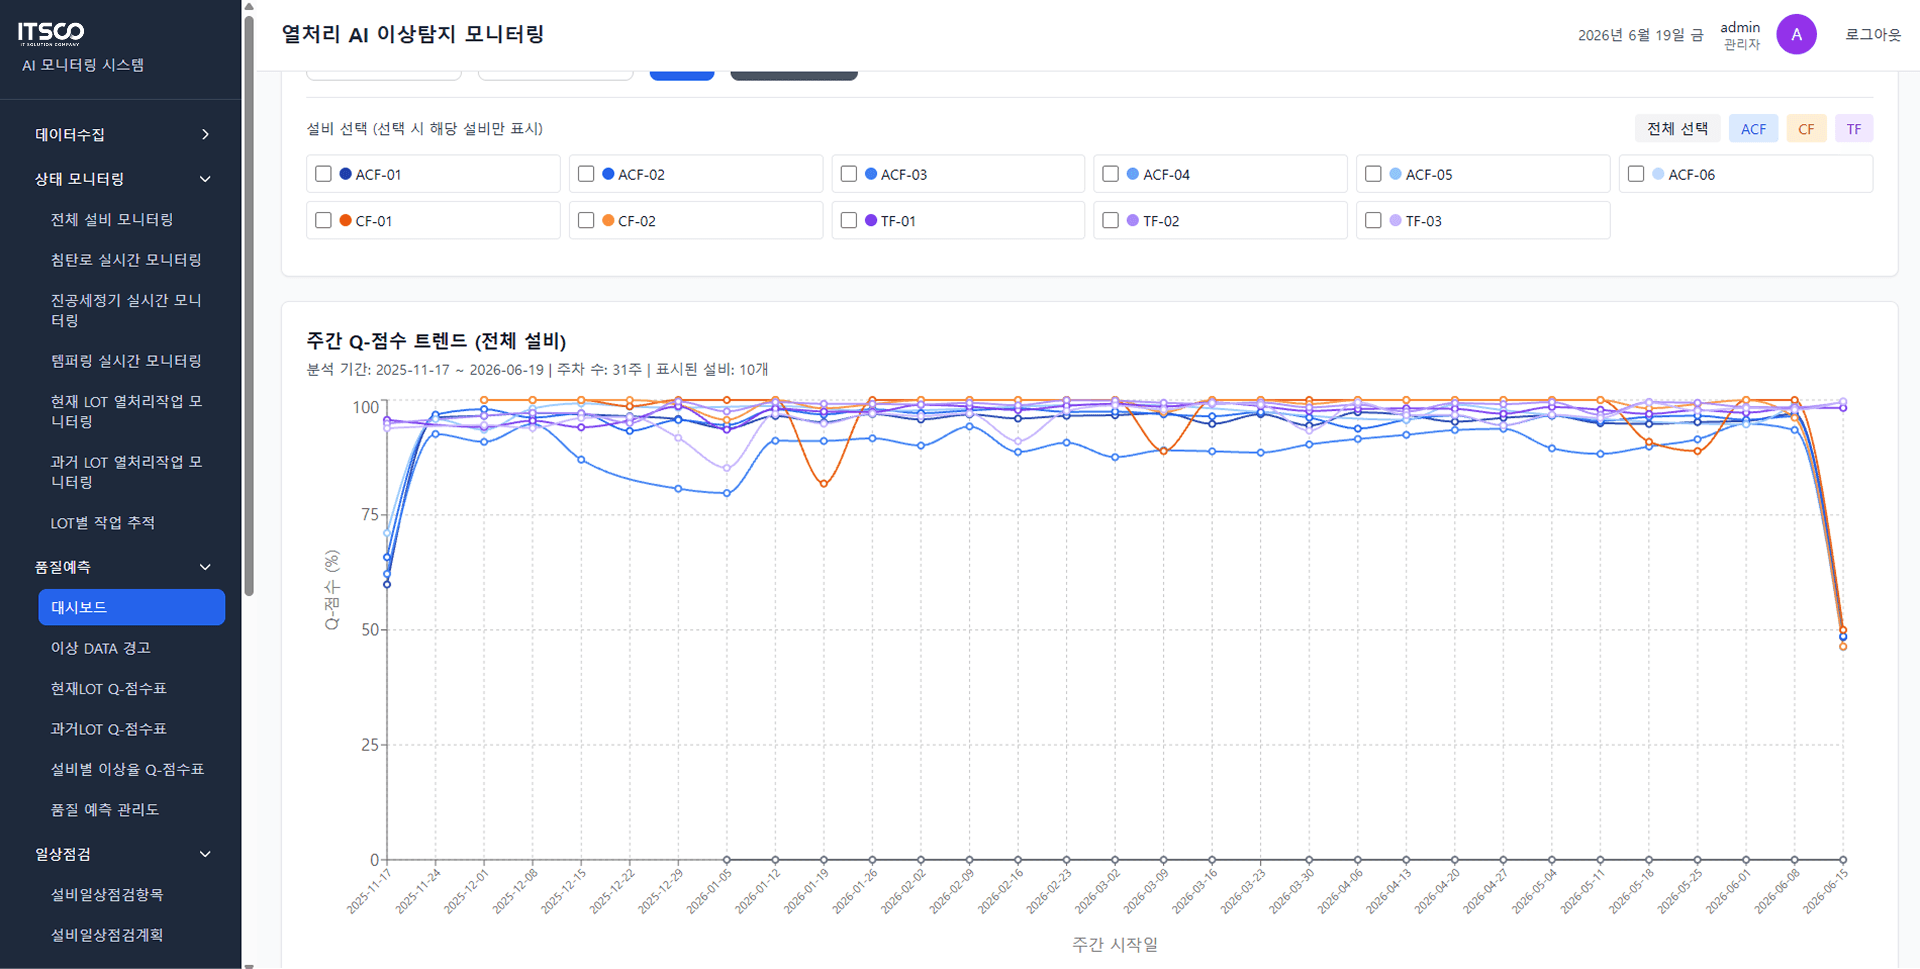
Real-time monitoring dashboard
An interface that collects process data and equipment status in real time and shows them visually
SYSTEM ARCHITECTURE
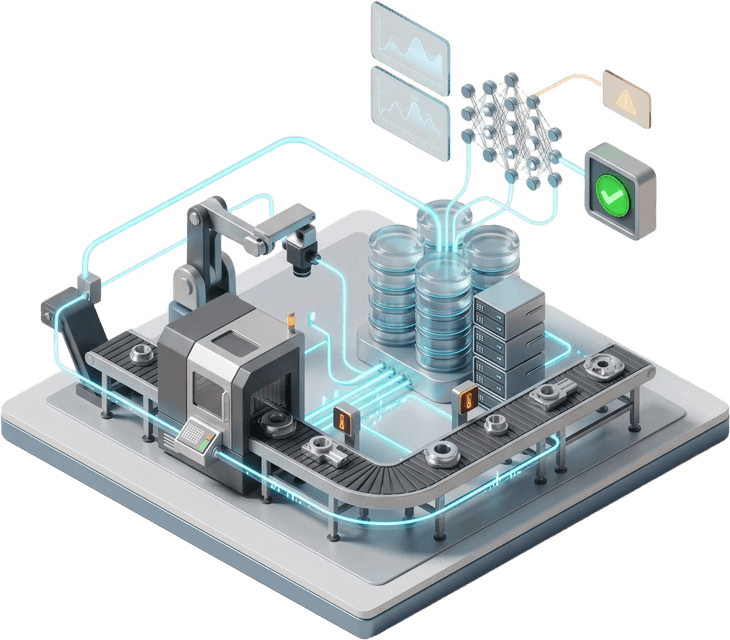
A three-stage pipeline: floor data collected, learned by models, and returned to the operating systems.
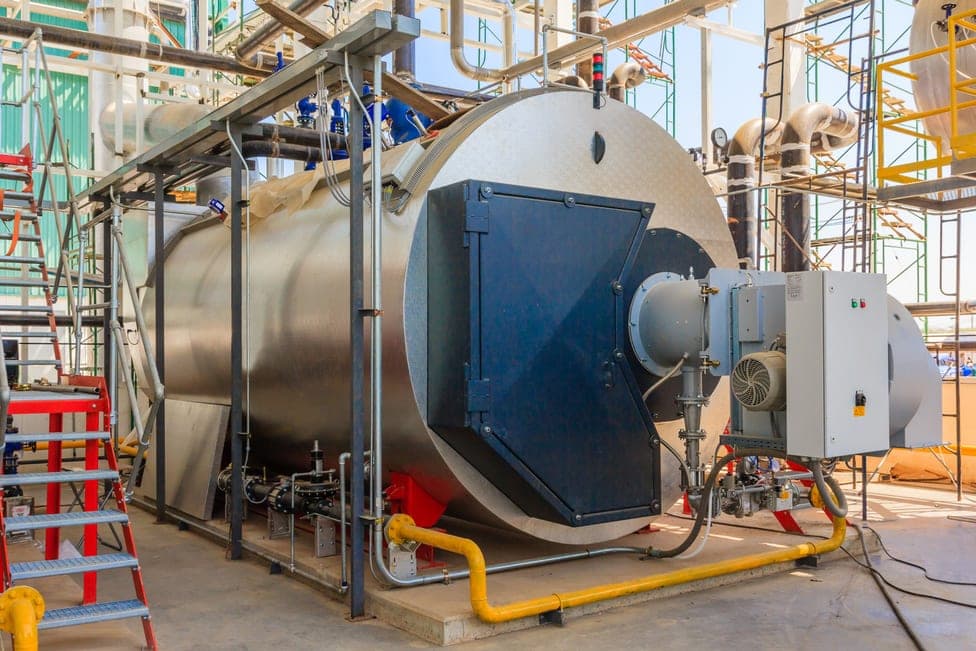
Heat treatment
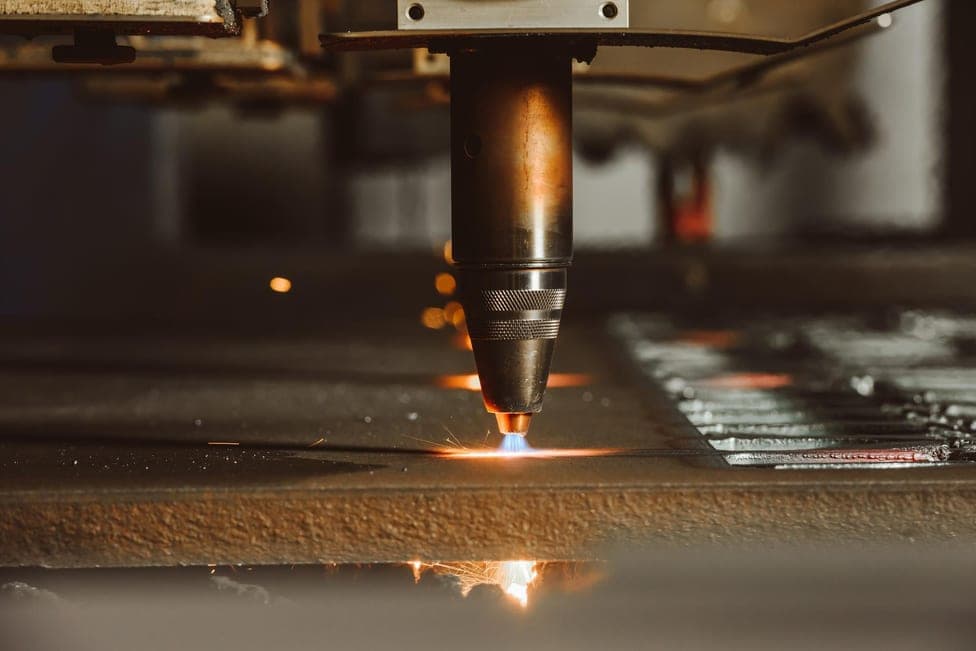
Metalworking
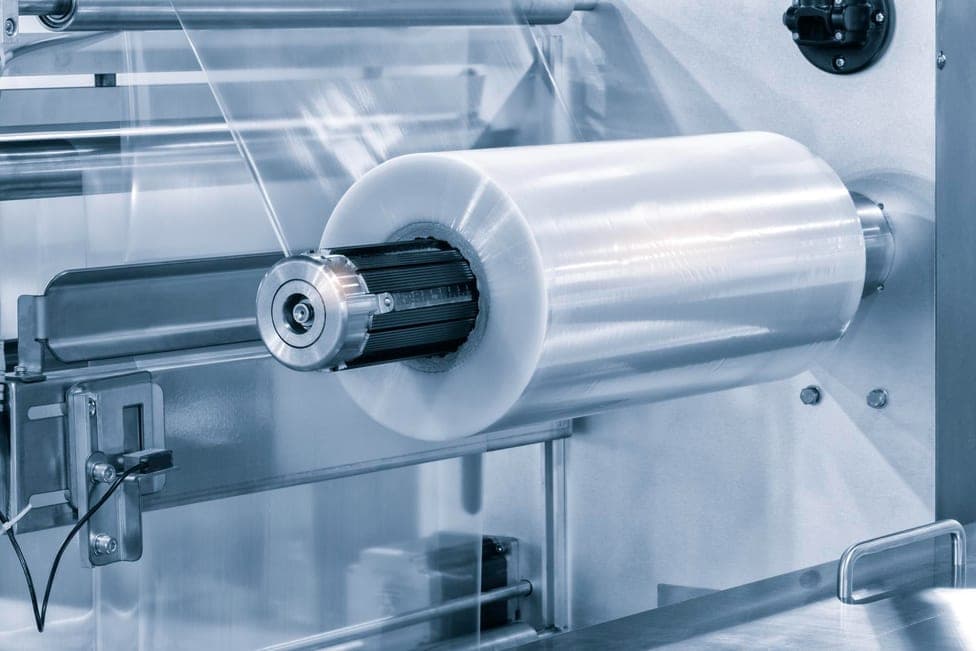
Coating
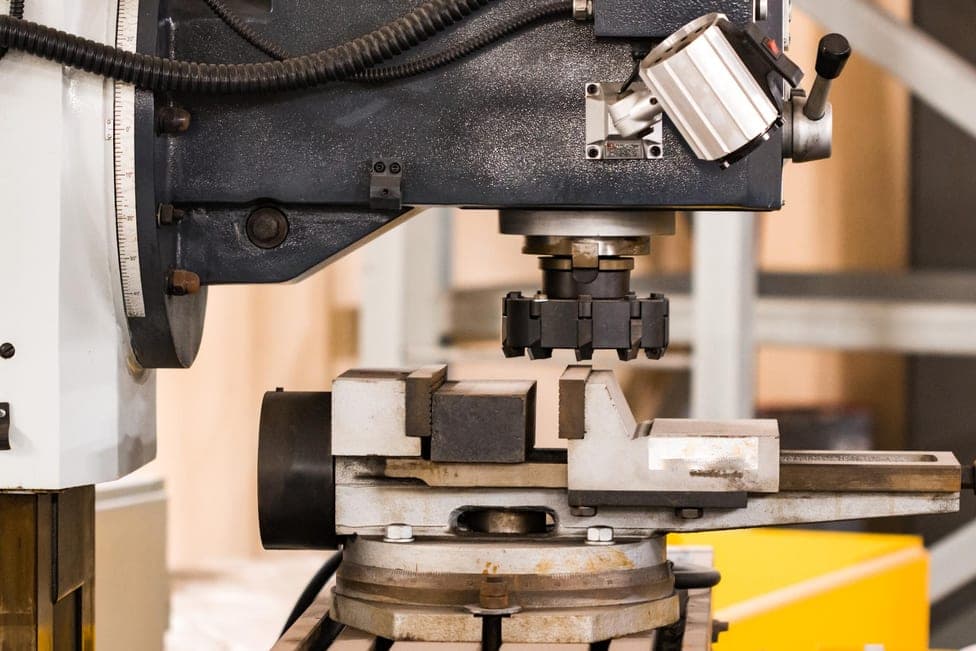
Press
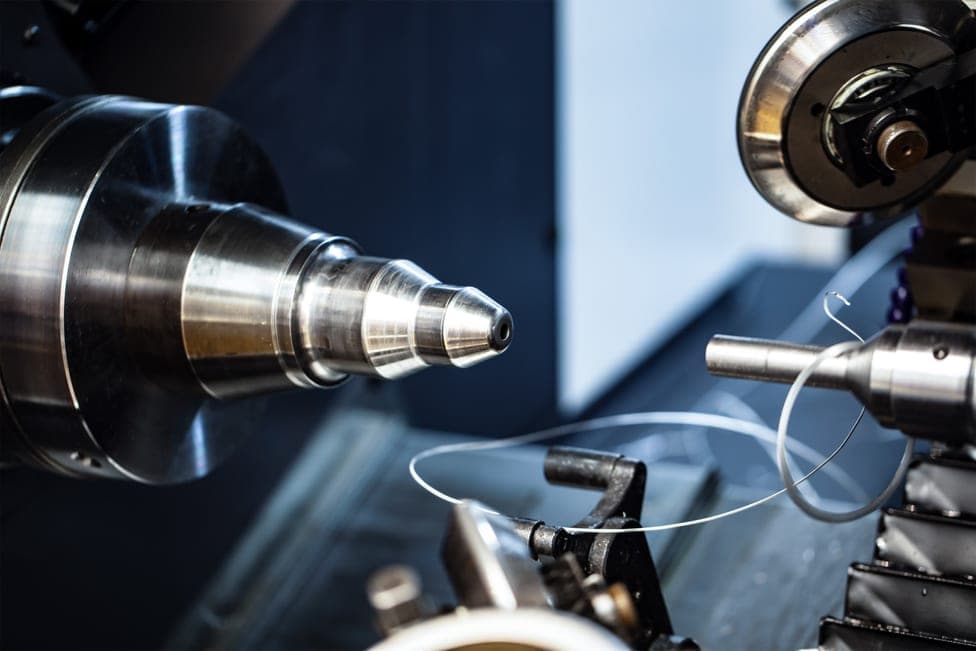
CNC machining
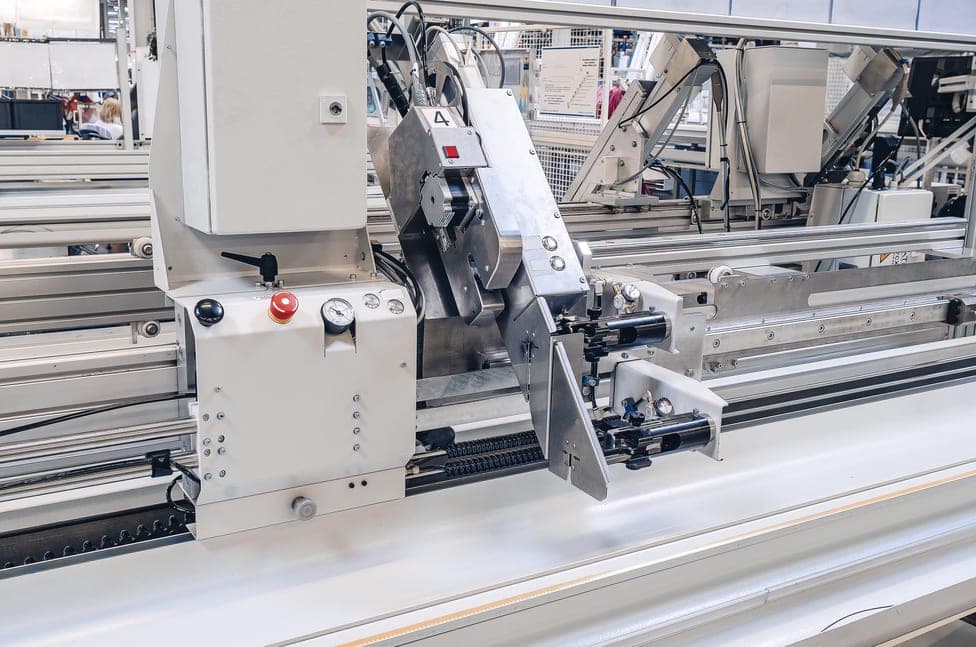
Injection molding
Heat treatment
Metalworking
Coating
Press
CNC machining
Injection molding
Defects are predicted before they happen, not found after.
EFFECT
What it leaves behind — in defect rate, rework, unit cost and productivity.
BUSINESS OUTCOME
Lower defect rate
Trend analysis corrects small deviations automatically, and machine learning finds what degrades quality so optimal conditions are set quickly.
Defect rate · quality variation · set-points
Less rework
The predicted defect probability is fed back into the process conditions, so less comes back for rework at all and the line no longer stalls waiting to re-run it.
Rework volume · re-runs · line stalls
Lower unit cost
Scrapping a finished part is avoided, and the energy cost per unit of stable quality plus post-shipment logistics and warranty cost come down.
Scrap loss · energy cost · warranty cost
Higher productivity
Time data locates the bottleneck and immediate feedback corrects the conditions, lifting the hourly output the same equipment delivers.
Hourly output · bottlenecks · equipment uptime
CASE STUDY
Quality variation in the carburising process quantified as a Q-score and linked to the MES.
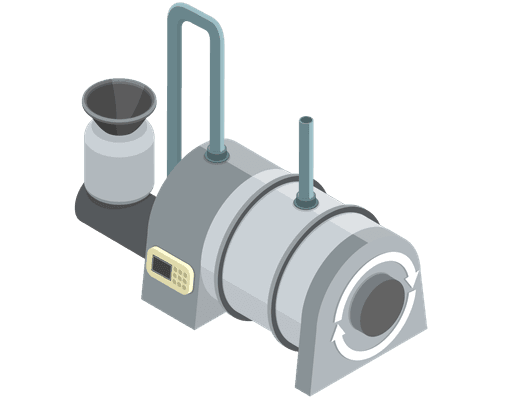
Customer industry
Metal heat treatment
Before01
After02
Results
AI quality prediction that replaced inspection with foresight
Defects do not fall by inspecting more. They fall by predicting.
Where to start collecting process data and which measure to predict first — designed around your own line.
Talk to us